


Questions on Data from Hypothetical Case Control: Biostatistics Assignment 2 Answer

Answer
Question 1(a)
The observed proportion of patients in the study living alone is given in the table below
Table 1: Proportion of patients living alone
The variable livealone was defined as 1 for living alone patients and 0 for patients who is not living alone. The proportion of living alone is thus given in table as mean of the variable livealone which is equal to to 4 decimal places. This implies that, from the study 44.05% of the patients under investigation are living alone while 55.95% of the patients are not living alone.
Question 1(b)
The 90% confidence Interval for the population proportion is provided in table 2
Table 2: 90% Confidence foe proportion of patients living alone
The 90% Confidence interval for patients living alone is obtainable from row tagged as 1 which represent the living alone patients. The computed 90% CI is [0.4130, 0.4683] which tells us that, proportion of patients living alone in the population is between 41.30% and 46.83%.
Question 1(c)
The Three measures of association for binary exposure (living alone) and binary outcome (mortality) include;
- Risk Difference
- Relative Risk
- Odds Ratio
Question 1(d)
The 2 x 2 table for living alone and mortality is given in table 3;
Table 3: 2 x 2 for living alone and mortality
The table 3 indicates that out of the 874 total patients in the sample study, patients who lives alone and died afterward amount to 116, while patients who died but not live alone are 84 in total. 269 patients are alive and lives alone while 405 patients that does not live alone and alive after the follow up is 405 in total.
The valid measure of association is provided in table 4;
Table 4: Measure of Association of living alone and mortality
The upper part of table 4 also display a 2 x 2 for the association, with cases as patients who died and non-cases as the control while the exposed indicates living alone patients and unexposed is not living alone patients. The measure of association are obtainable from the lower part of the table 4 alongside their 95% CI. The risk difference is 0.1295 which indicate that patients died more when exposed to living alone that those patients not living alone and confidence interval is between 0.0728 to 0.1862. the Risk Ratio is 1.7540 which implies that the probability of patients who lives alone are 1.754 times more likely to die than patients who are not living alone and the 95% CI is between 1.3700 to 2.2454. The Computed Odds Ratio is 2.0791 suggesting that the odds of patients who lives alone are 2.0791 more likely to die that patients that are not living alone and the 95% CI is between 1.5102 to 2.8623 using the cornfield approach. Notice that the 95% CI for risk difference exclude the 0, while that of risk ratio and odds ratio exclude 1 which implies that mortality after the follow up associated with patients living alone. The result of the association is supported by the Chi squares test of association with p-value <0.001 suggesting existence of association between living alone and mortality.
Question 2(a)
The odds ratio for the association between the diabetes and high blood pressure are given 5 and table 6 for Aboriginal and TSI
Table 5: Result for association between Diabetes and high blood pressure for Aboriginal
The result shows that the odds ratio computed for Aboriginal people is 1.1934 and it implies that Aboriginal people who are diabetic are 19.34% times more likely to have high blood pressure than those without diabetes noting that the confidence interval span between 0.8292 to 1.7120 with the inclusion of 1 suggesting that association between diabetes and high blood pressure Is weak and this is supported by the p-value = 0.3180 from the chi square test which says no significant association.
Also, The result from table 6 shows that the odds ratio computed for TSI people is 1.0870 and it implies that Aboriginal people who are diabetic are 8.70% times more likely to have high blood pressure than those without diabetes noting that the confidence interval span between 0.6058 to 1.9169 with the inclusion of 1 suggesting that association between diabetes and high blood pressure Is weak and this is supported by the p-value = 0.7615 from the chi square test which says no significant association.
Table 6: Result for association between Diabetes and high blood pressure for TSI
Question 2(b)
The result are given in table 7 and table 8 for association between the diabetes and high blood pressure while controlling for BMI separately for Aboriginal and TSI.
Table 7
The Odds Ratio and 95% CI for Aboriginal
Normal Weight
Odds ratio = 1.1507, 95% CI = [0.6509, 1.9996],
Overweight
Odds ratio= 1.0142, 95% CI = [0.5627, 1.8349]
The result shows that aboriginal people with diabetes are 15.07% and 1.42% respectively more likely to have high blood pressure than those without diabetes for normal and overweight while cases of high blood pressure will occur more frequently among aboriginal people with normal weight. The CI suggest that the association between the diabetes and high blood pressure are weak irrespective of BMI status of the aboriginal people.
Table 8
The Odds Ratio and 95% CI for TSI
Normal Weight
Odds ratio = 1.0124, 95% CI = [0.5068, 1.9672]
Overweight
Odds ratio= 1.4222, 95% CI = [0.4107, 4.7063]
The result shows that TSI people with diabetes are 1.24% and 42.22% respectively more likely to have high blood pressure than those without diabetes for normal and overweight while cases of high blood pressure will occur more frequently among TSI people with overweight. The CI suggest that the association between the diabetes and high blood pressure are weak irrespective of BMI status of the aboriginal people.
Question 2(c)
The result of Mantel-Haenszel estimate of the odds ratio for the association between diabetes and high blood pressure pooled over the weight categories, separately for (i) Aboriginal and (ii) Torres Strait Islander people are given in table 9.
Table 9: Result of Mantel-Haenszel estimate of the odds ratio
Question 2(d)
The computed Odds ratios and 95% CI in 2a with those obtained using the Mantel-Haenszel pooled over the weight categories in 2c are the same. The result suggest no evidence of confounder since no difference in the former compared with the later.
Table 10
Question 3(a)
| Trial | Sample size | Difference in sample proportions (placebo vs. drug) | Standard error for the difference in sample proportions | 95% CI for the difference in population proportions | p-value |
| 1 | 50 | -0.2400 | 0.127 | [-0.4899, 0.0099] | 0.069 |
| 2 | 300 | -0.3067 | 0.052 | [-0.4086, -0.2047] | 0.000 |
| 3 | 300 | -0.1800 | 0.057 | [-0.2913, -0.0687] | 0.002 |
| 4 | 300 | -0.2067 | 0.058 | [-0.3174, -0.0960] | 0.000 |
Question 3(b)
At trial 1 with sample size 50, the proportion of children who had pain relief in two hours is higher when treated with ibruprofen than using placebo. The p-value thus indicates that at 5% level, no significant difference either children are treated with ibruprofen or using ordinary placebo with the interval spanning between -0.4899 to 0.0099.
At trial 2 with sample size 300, the proportion of children who had pain relief in two hours is higher when treated with ibruprofen than using placebo. The p-value thus indicates that at 5% level, a significant difference exist between children treated with ibruprofen and using ordinary placebo with the interval spanning between -0.4086 to -0.2047.
At trial 3 with sample size 300, the proportion of children who had pain relief in two hours is higher when treated with acetaminofen than using placebo. The p-value thus indicates that at 5% level, a significant difference exist between children treated with acetaminofen and using ordinary placebo with the interval spanning between -0.2913 to -0.0687. The result interpretation for trial 4 is the same with that of trial 3 with different value of confidence interval.
Question 3(c)
Based on the result obtained, ibruprofen is more effective for treating children with migraines this is because, its absolute proportion difference in the two trials( trial 1 and 2) are higher than that of the trials for acetaminophen and its passes the clinical yardstick of 15% unit.
Question 4(a)
The probability that the trial would fail to detect a true risk ratio of 0.80 is 15% since the trial has 85% power of detecting the risk and as such the probability that the trial would fail to detect the true risk would be (100-85)% = 15%.
Question 4(b)
The probability of failing to detect the true risk of 0.8 can be reduced by reduction of the sample size required for the trial.
Question 4(c)
Standard Deviation
Question 4(d)
Low power are less likely to produce significant results, even though a clinically meaningful effect does exist. Lack of statistical significance does not imply no significant effect; however, it is an outcome of small sample size (or low power). Therefore, it is important to have adequate sample size and sufficient power.
Question 5(a)
The formula to compute the sample size is given as;
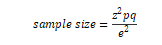
Where z is the tabulate normal value usually 1.96 for 95% confidence interval, while e is the error margin, p=17/63 and q=1-p as given from the question
Thus the sample size required is;

The sample size to achieve precision with 95%CI and the proportion obtained from the pilot study is 1892.
Question 5(b)
The higher the precision, the higher the sample size at a fixed confidence interval and fixed p.
Question 5(c)
For fixed, precision and confidence with p ranging from 0 to 1. The following table were obtained with the figure 1. The value of p that gives the maximum value of the required was bolded in the above table. The p is thus 0.5 which gives the maximum sample size of 2401. It thus shows a pattern forming a bell-Curve Shape
Table 11
| p | q | Sample Size |
| 0.00 | 1.00 | 0 |
| 0.05 | 0.95 | 456 |
| 0.10 | 0.90 | 864 |
| 0.15 | 0.85 | 1225 |
| 0.20 | 0.80 | 1537 |
| 0.25 | 0.75 | 1801 |
| 0.30 | 0.70 | 2017 |
| 0.35 | 0.65 | 2185 |
| 0.40 | 0.60 | 2305 |
| 0.45 | 0.55 | 2377 |
| 0.50 | 0.50 | 2401 |
| 0.55 | 0.45 | 2377 |
| 0.60 | 0.40 | 2305 |
| 0.65 | 0.35 | 2185 |
| 0.70 | 0.30 | 2017 |
| 0.75 | 0.25 | 1801 |
| 0.80 | 0.20 | 1537 |
| 0.85 | 0.15 | 1225 |
| 0.90 | 0.10 | 864 |
| 0.95 | 0.05 | 456 |
| 1.00 | 0.00 | 0 |
Figure 1: Plot of P against Sample Size

Customer Testimonials


