


ECO100 Understanding and Applying Economic Principles Assessment 3 Answer

Answer
Q1a)
| Price (dollars per chip) | Quantity demanded (millions of chips per year) | Total Revenue ($millions) |
| 200 | 50 | 10,000 |
| 250 | 45 | 11,250 |
| 300 | 40 | 12,000 |
| 350 | 35 | 12,250 |
| 400 | 30 | 12,000 |
As seen above, when price is $400 per chip, total revenue is $12,000mn and when price reduces to $350 per chip, the total revenue increases to $12,250mn.
Q1b)
As seen above, when price is $300 per chip, total revenue is $12,000mn and when price increases to $350 per chip, the total revenue increases to $12,250mn. Hence, increase in price caused an increase in total revenue, implying that the demand is inelastic at $300 price as increase in price to $350 does not have a very large impact on quantity demanded.
Q1c)
| %change | Income Elasticity of demand | |||
| Income> | $ 3,000.00 | $ 5,000.00 | 0.667 | |
| Qty Rice (kg) | 5 | 4 | -0.200 | -0.300 |
| Qty Beef (kg) | 2 | 3.5 | 0.750 | 1.125 |
Income elasticity of beef is calculated as %change in quantity of beef/%change in income. As seen in last column above, it is 1.125:
%Change in quantity = (3.5-2)/2 = 0.75
%Change in income = (5000-3000)/3000 = 0.667
Income Elasticity = 0.75/0.667 = 1.125
Q1d)
Similar to above calculations, income elasticity of rice has been calculated as -0.200. An inferior good has negative income elasticity as its quantity demanded reduces as income increases. This is the case with rice. Hence, rice is inferior good.
Q1e)
The income elasticity of beef is 1.125 which is positive and greater than one. This indicates beef is normal good and also a luxury good. The elasticity of demand for superior or luxury goods is usually high indicating that these goods are sensitive to price changes. This means that increase in price will lead to reduction in quantity demanded. Hence, if beef price increases by 15%, it being a luxury good which has usually high elasticity of demand, the change in quantity demanded will be more than 15%. Blue is the demand curve and red is the supply curve. Small increase in P has led to much larger change in Q.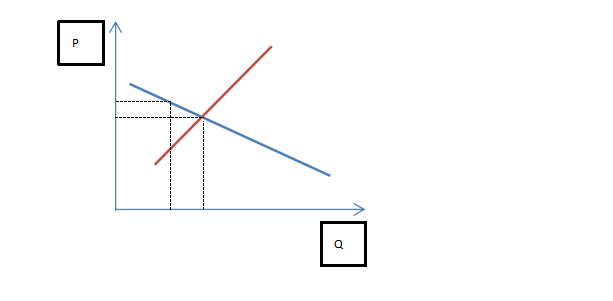
Q2a)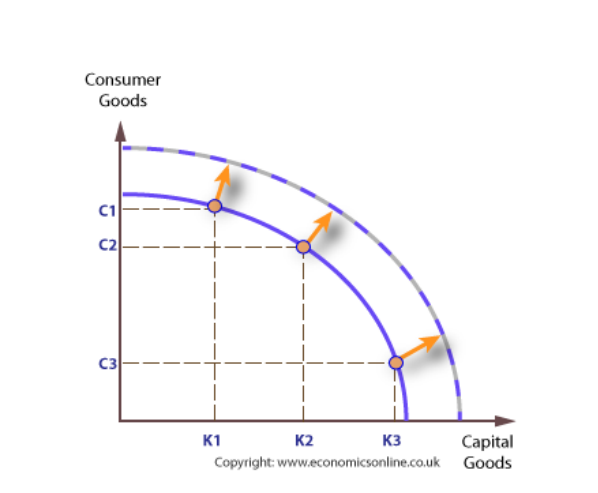
The above diagram indicates production possibility frontier or PPF whereby x-axis represents quantity of capital good produced and y-axis represents consumer goods produced in an economy. The blue concave curve is the PPF. Any production combination that lies inside this PPF is inefficient as economy can produce more with given resources. Any point outside this PPF is unachievable with given resources.
If an economy is producing C1 quantity of Consumer goods, it will be able to produce K1 of capital goods. If an economy wants to produce more of capital goods, say K2, then it will have to reduce output of consumer goods to C2. Hence, with limited resources available to an economy, it has to allocate the resources to produce types of goods as required or desired. However, an economy has to do a trade-off such that it will produce less of one type of good to produce more of another type of good. Hence, an economy will be unable to produce C1 of consumer goods and K3 (or K2) of capital goods at a given point of time.
The concave shape of the PPF curve is due to increasing Marginal opportunity cost. This is because in order to produce one more unit of another good, more units of the good will have to be sacrificed. This is because resources are limited and not equally efficient in producing both the goods. Hence, more resources will be required to produce additional unit of other good. This leads to concave shape of the PF.
Q2b)
In such a case the PPF will face an asymmetric outward shift of PPF: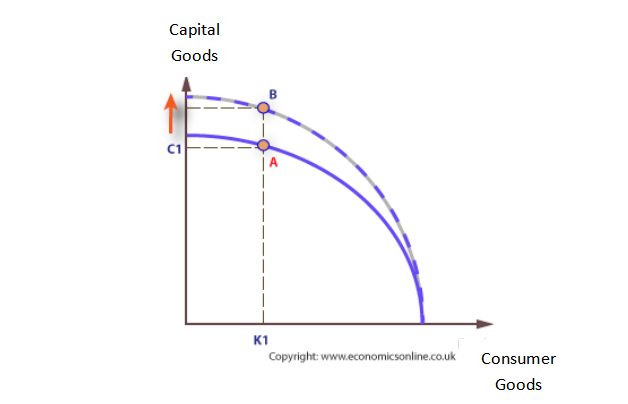
As seen, the PPF will shift outwards but only on axis representing production of capital goods. For the other axis, that is, consumer goods, the PPF will remain same as before.
Q2c)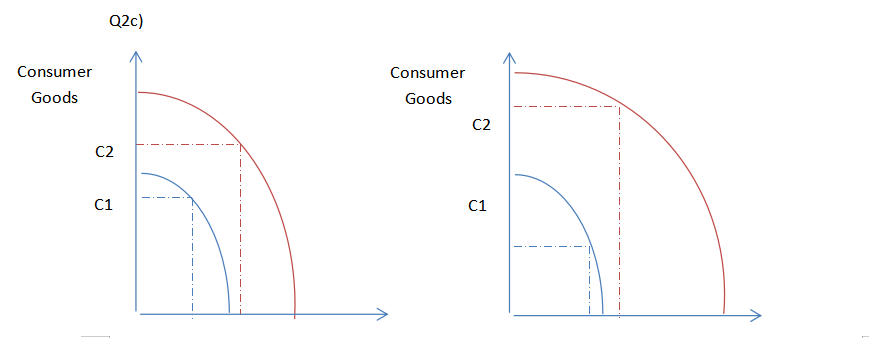
The first graph indicates PPF’s for Country 1 that invests only 5% in capital goods and rest in consumer goods as indicated by K1 and C1 combination on blue PPF. After 10 years, it may increase resources or technology or both to reach red PPF and start producing more at K2 and C2 combination.
The second graph indicates PPF’s for Country 2 that invests 30% in capital goods and rest in consumer goods as indicated by K1 and C1 combination on blue PPF. After 10 years, it will increase resources or technology or both to reach red PPF and start producing more at K2 and C2 combination.
The difference is the extent of outward shift in PPF. For Country 2, the shift is much more pronounced leading to its increased capacity of both C2 and K2 levels. Both countries started with similar PPF’s but due to more investment in capital goods, research etc., Country 2 has been able to shift its PPF outwards better.
Q3a)
As mentioned in the question, the Bush fires and drought have destroyed banana farms in Australia. This will reduce the available supply of bananas as most of the crop would have been destroyed due to the bush fires and drought. This will cause the supply curve to shift to left such that the supply of bananas will reduce.
Q3b)
As discussed in above question, the available supply of bananas will reduce as most of the crop would have been destroyed due to the bush fires and drought. This will cause the supply curve to shift to left such that the supply of bananas will reduce.
On the other hand, if the demand for bananas increases due to some reason immediately after the bushfires and droughts, it will lead to increase in demand for bananas such that the demand curve will shift upwards.
This is indicated in graph below: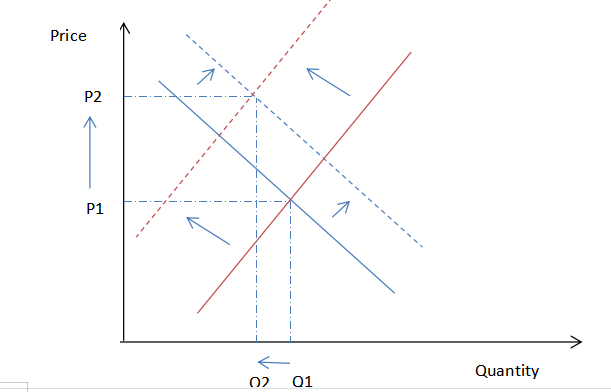
In the above graph, the quantity of bananas is on x-axis while price is on y-axis. The Blue solid line is initial demand curve and red solid line is initial supply curve. The points at which these two curves intersect provide the equilibrium price of P1 and equilibrium quantity of Q1.
Then, after the bushfires and droughts in Australia, most of the crop of banana got damaged leading to less supply of banana. This causes the supply curve to shift to left from red solid line to red dotted line.
At the same time, the demand for bananas increases immediately after the bushfires and droughts such that he demand curve shifts upwards from blue solid line to blue dotted line.
The intersection of the dotted red line (supply) and dotted blue line (demand) provide the new equilibrium price of P2 and new equilibrium quantity of Q2. It can be seen that price has increased tremendously from P1 to P2 while quantity has reduced slightly from Q1 to Q2. This is because bananas are unavailable due to destruction of crops that has caused a shortage and the limited available quantity of bananas is getting sold at very high prices.
Q3c)
If the trial is successful, then the manufacturers will start growing the new species of banana and after three months, the supply of bananas will start increasing in the market. This will make the supply curve to shift to right.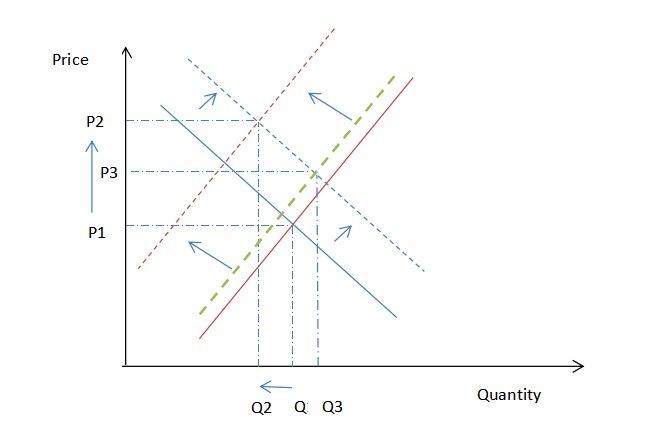
The above graph is the same where supply has reduced and demand had increased leading to equilibrium at much higher price P2 and a lower quantity at Q2.
Now, if the supply of bananas increases due to new trials, the supply curve will shift to right to green dotted line. This will intersect with the same dotted demand curve as before. The new equilibrium is at lower price P3 and higher quantity of Q3.
Hence, due to supply of new variety of banana, the supply situation has improved leading to lowering of prices that had shot up due to shortage. The supply quantity has also increased.
The assumption is that the new variety of banana is same as the previous variety and consumers are indifferent between the two.

Customer Testimonials


