


BUSSB2012 Case of Sindbad Logistics for Receiving Customer Order: Research Method Assessment Answer


Answer
| Research Methods, Data & Analytics & PP |
| BUSS-B-2012 |
Introduction
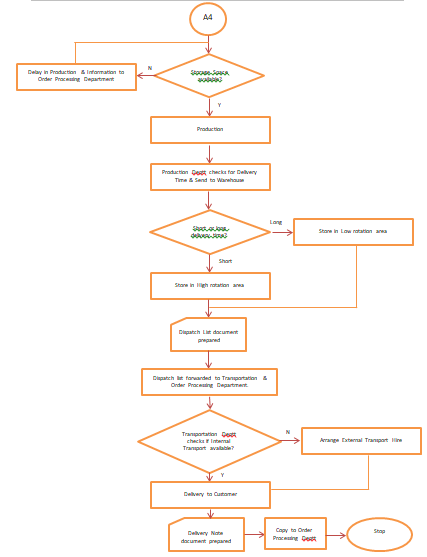
The following pages discuss the case of an Oman-based Logistics Company called Sindbad Logistics and what process is followed from the step of receiving customer order till the delivery to customers.
Answer 1: Process Map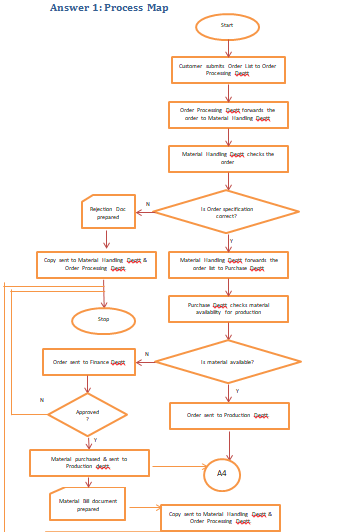
Answer 2a:
A process of ordering food from an office cafeteria is being considered. The cafeteria provides food and beverages through use of food card that can be taken by paying amount to the cashier in the cafeteria.
Once the food card has been taken, the card has unlimited validity and can be easily recharged through various methods, such as, cash to the cashier or through e-wallets or net banking.
The cafeteria provides multiple options through various food and beverages stalls. The options include Arabian, Indian, Chinese, and Continental stalls. The customer can get the food card swiped at any of the stalls and the server will generate the waiting number for the order and provide receipt bill for the same. Once the order is ready, the waiting number will be displayed at the digital counters visible from various sitting locations. The customer can go and receive the order on showing the bill.
Once the customer is done eating, the plates will be automatically collected by the staff and washed for next use. In case of any complaints or suggestions, the customer can use the drop box available in the food court. The drop box is operated by the HR department of the company and is used for controlling vendor’s food quality, hygiene etc.
Answer 2b:
The selected questions for measuring the above process are:
- Age:
- <25 years
- 25-40 years
- 40-60 years
- >60 years
- Gender:
- Male
- Female
- Annual Income:
- 0-50,000
- 50,000-70,000
- 70,000-100,000
- 100,000 and above
- What is the monthly frequency of using cafeteria services:
- 0-10 times
- 10-50 times
- 50-80 times
- More than 80 times
- What is your average monthly spending on cafeteria services:
- Can you rank the food in order of liking (1 being the most liked)
- Arabian
- Indian
- Chinese
- Continental
- On a scale of 1-5, how will you rate cafeteria’s hygiene (1 being the best and 5 being the worst):
- 1
- 2
- 3
- 4
- 5
- On a scale of 1-5, how will you rate cafeteria food and beverage selection (1 being the best and 5 being the worst):
- 1
- 2
- 3
- 4
- 5
- On a scale of 1-5, how will you rate cafeteria ambience (1 being the best and 5 being the worst):
- 1
- 2
- 3
- 4
- 5
- Any suggestions or feedback____________________________________________________
Answer 2c:
The above questions cover different types of variables as mentioned in below table:
| # | Question | Variable Type |
| 1 | Age: | Ratio/Continuous |
| 2 | Gender: | Nominal (Dichotomous) |
| 3 | Annual Income: | Interval |
| 4 | What is the monthly frequency of using cafeteria services: | Ratio |
| 5 | What is your average monthly spending on cafeteria services: | Numerical |
| 6 | Can you rank the food in order of liking (1 being the most liked) | Ordinal |
| 7 | On a scale of 1-5, how will you rate cafeteria’s hygiene (1 being the best and 5 being the worst): | Ordinal |
| 8 | On a scale of 1-5, how will you rate cafeteria food and beverage selection (1 being the best and 5 being the worst): | Ordinal |
| 9 | On a scale of 1-5, how will you rate cafeteria ambience (1 being the best and 5 being the worst): | Ordinal |
| 10 | Any suggestions or feedback____________________________________________________ | Qualitative |
Answer 3:
For the above questionnaire, the data has been generated using ‘RAND’ function in excel. Then, a sheet has been created ‘Frozen Data’ which has been used for analysis. The frozen data sheet is created as ‘RAND” will keep changing values every time the file is opened.
The first technique used for analysis is through graphs that reveal a lot of trend in the responses.
A stacked bar graph has been made for various ordinal variable related questions to see how respondents rank the factors, hygiene, food selection, and food quality and cafeteria ambience.
It can be seen that majority of people have ranked food quality as 3-5 (the lower rankings). Also, the ambience has been ranked as 4 by maximum respondents. This indicates that majority of respondents have issues with food quality as well as ambience. This can be further investigated and steps be taken to improve the same. Similarly, a lot of people have marked food selection as 4 and 5.
The cuisine preference is as follows:
Maximum respondents prefer Arabian cuisine closely followed by Chinese and Continental cuisines.
The data analysed may indicate that food being served in cafeteria is not as per customer preference. If changed, it may lead to win-win for all as customers will get their preferred food and vendors will get higher revenue.
The second technique is testing of association between two categorical variables. The selected variables are gender and annual income and effort will be made to see if there is any relationship between the two.
| Count of Annual Income | Column Labels | ||||
| Row Labels | 0-50,000 | 100,000 and above | 50,000-70,000 | 70,000-100,000 | Grand Total |
| Female | 5 | 2 | 4 | 4 | 15 |
| Male | 2 | 4 | 3 | 1 | 10 |
| Grand Total | 7 | 6 | 7 | 5 | 25 |
α = 0.05
The total sample size is 25 with two variables: gender and annual income.
The null and alternative hypothesis can be stated as:
H0: In the population, there is no association between gender and annual income.
H1: In the population, there is no association between gender and annual income.
We will use chi-squared test for association.
Expected value table is as follows:
| 0-50,000 | 100,000 and above | 50,000-70,000 | 70,000-100,000 | |
| Female | 5 (4.2) [0.15] | 2 (3.60)[0.71] | 4 (4.20)[0.01] | 4 (3.00)[0.33] |
| Male | 2 (2.80)[0.23] | 4 (2.40)[1.07] | 3 (2.80)[0.01] | 1 (2.00)[0.5] |
Chi square stat is 3.0159 and corresponding p-value is 0.389184.
At 0.05 significance level, p-value is not significant. Hence, we cannot reject the null hypothesis. We can conclude that in the population, there is no association between gender and annual income.
The third technique used is difference in means through statistical testing.
| Row Labels | Average of Monthly Spending | StdDev of Monthly Spending | Count of Monthly Spending |
| Female | 1,726.07 | 883.44 | 15.00 |
| Male | 1,345.80 | 878.53 | 10.00 |
| Grand Total | 1,573.96 | 883.66 | 25.00 |
| Difference | 380.27 | 4.92 |
α = 0.05
The null and alternative hypothesis can be stated as:
H0: µf = µm
H1: µf ≠ µm
We will use a two-tailed test for independent samples. Hence, we will use t-test for independent means:
Pooled SD = √((nf-1)sf2+(nm-1)sm2)/ (nf + nm +2)
= √(15-1)883.442 + (10-1)878.532/(15+10+2)
= √(10926634.93+6946275.6/27
= √661959.65
= 813.61
SE = pooled SD x √(1/nf) + (1/nm)
= 813.61 x √1/15 + 1/10
= 813.61 x 0.40825
= 332.16
t-stat = (µf – µm)/SE = 380.27/332.16 = 1.1448
df = nf+ nm -2 = 15+10-2 = 23
Using T.DIST.2T (1.1448,23) = 0.264
Hence, P(t23 > 1.1448) = 0.264
At significance level of 0.05, p-value of 0.264 is greater than the significance level. Hence, we do not have significant statistical evidence to reject the null hypothesis.
Hence, we can conclude that there is no significant difference between average spending by males and females.

Customer Testimonials


